2026-2
Project Management Context
Managing resources effectively is fundamental to project success as it helps in controlling costs, optimizing productivity, minimizing risks, ensuring quality, maintaining timelines, and satisfying stakeholders.
Effective resource management is a key competency for project managers and requires careful planning, coordination, and monitoring throughout the project lifecycle.
In addition to Work Allocation reports, BrightWork 365 also offers a Resource Utilization Power BI Dashboard, allowing users to view all the project task assignments across projects, and assess levels of resource utilization. The dashboard allows viewers to quickly determine whether a resource is under or over allocated with project tasks.
- The report pages are set to fit on the page. If you have a large monitor, this can lead to extra white space on the side margins of the report. Click F11 on your keyboard to reduce this effect by opening the report in Full Screen Mode. Click F11 again to return to the normal view.
- See also Power BI Dashboards Overview.
- See Security and Power BI Reports for important information related to user access to reports.
Resource Utilization

By default, the Resource Utilization page shows you how much scheduled work each resource is assigned over the next 6 weeks and what their current capacity is.
Each resource is assumed to have 8 hours availability per working day. Multiple this by the number of working days specified in Admin Area > Global Settings, and you will get the typical resource availability for a given week, i.e., 8 x 5 = 40 hours. If a resource is working on a project with a longer working week, then their availability will increase.
The default time grouping is weeks. You can drill up to months or down to days, using the drill buttons in the bottom right of the visual - hover over the main visual to make the buttons appear.

- “Availability” is set to the highest number of working Days as set by a project. For example, if some of a resource's projects are 5 day a week projects, another project is a 6 day a week project, and another project is a 7 day a week project – the resource's availability is set to the maximum one – in this case 7 days.
- To reset a Team Member's availability, remove them from the project.
Legend

The legend provides a definition of the color-coding present throughout the Main Window, making it easier for users to understand the data they're viewing.
Date Range & Filters
Use the Date Range and Filter options to further refine the scope of the Resource Utilization content.
Resource Dashboard

The Resource Dashboard page gives you a more detailed view of what scheduled work each resource is assigned and allows you to focus on one or more individuals to understand why they are over or under resourced.
Click on a user's name on the resource bar chart on the right to focus on this user. Use Ctrl-click to focus on two or more users.
Right-click on a user's name in the main visual and click Expand | All to see all the scheduled work that the user is assigned.

Date Range & Filters
Use the Date Range and Filter options to further refine the scope of the Resource Dashboard content.
Project Calendars

The Project Calendars page shows you each project's calendar. This page is particularly useful if you have a project that has a working week that is different than the global setting or has project exception days.
There are two types of Project Exception Days:
- Working Day: Use this to cancel a Non-Working Day.
- Non-Working Day: Use this to make a working day for a particular project into a non-working day.
Date Range & Filters
Use the Date Range and Filter options to further refine the scope of the Project Calendars content.
Resource Utilization Adjustment Process
When adjusting resourcing, the Project Manager can launch the resource report in the Power BI service and download the related PBIX file to open the new resource report in Power BI Desktop. They can then make assignment adjustments in the BrightWork 365 app and view the effects of these changes in realtime using Power BI Desktop, which allows unlimited refreshes of the report data unlike other methods of using Power BI which have limited daily refreshes. This cycle of Adjust in the app > View in Power BI Desktop > Adjust in the app, can be repeated as often as necessary to balance resource workloads. Below are details for using the Resource Utilization Adjustment Process.
Open in Power BI

The Open in Power BI link will open the report in the Power BI Service, displaying the report in a separate webpage.
Download the Report PBIX File
Power BI Desktop is a free download from Microsoft.
- Users require Contributor permission in the relevant Power BI workspace to download the PBIX file.
- When users with Contributor permission access the Power BI My Work Dashboard, instead of only seeing their own work, they will see all users' work.
When using Power BI Desktop for resource utilization purposes be sure not to publish the report as this will affect all users of the report.
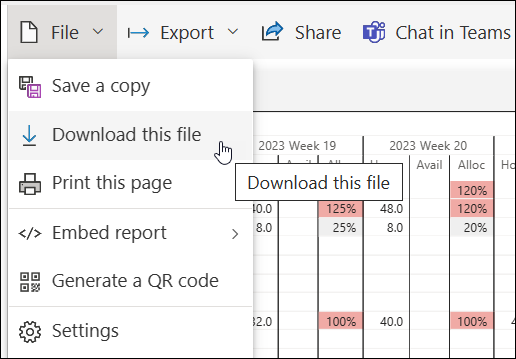
One of the added functions provided by the Power BI Service is the ability to download the PBIX file that is associated with the report, which can then be opened in Power BI Desktop. To download the file from the Power BI Service:
- Click File > Download this file.
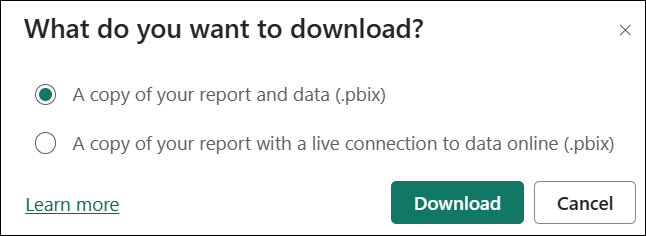
- Choose to download a copy of your report and data.


Open the PBIX File in Power BI Desktop
- When the file download initiated above is complete, open the PBIX file in Power BI Desktop.
- View the data in Power BI Desktop and choose to refresh the data as necessary using the Refresh option.
If values are missing for columns Hour and Alloc in Power BI Desktop when all rows are collapsed, expand any row and the missing values will be displayed.
2026-1 & 2025-2
Project Management Context
Managing resources effectively is fundamental to project success as it helps in controlling costs, optimizing productivity, minimizing risks, ensuring quality, maintaining timelines, and satisfying stakeholders.
Effective resource management is a key competency for project managers and requires careful planning, coordination, and monitoring throughout the project lifecycle.
In addition to Work Allocation reports, BrightWork 365 also offers a Resource Utilization Power BI Dashboard, allowing users to view all the project task assignments across projects, and assess levels of resource utilization. The dashboard allows viewers to quickly determine whether a resource is under or over allocated with project tasks.
The report pages are set to fit on the page. If you have a large monitor, this can lead to extra white space on the side margins of the report. Click F11 on your keyboard to reduce this effect by opening the report in Full Screen Mode. Click F11 again to return to the normal view.
Resource Utilization
By default, the Resource Utilization page shows you how much scheduled work each resource is assigned over the next 6 weeks and what their current capacity is.
Each resource is assumed to have 8 hours availability per working day. Multiple this by the number of working days specified in Admin Area > Global Settings, and you will get the typical resource availability for a given week, i.e., 8 x 5 = 40 hours. If a resource is working on a project with a longer working week, then their availability will increase.
The default time grouping is weeks. You can drill up to months or down to days, using the drill buttons in the bottom right of the visual - hover over the main visual to make the buttons appear.
- “Availability” is set to the highest number of working Days as set by a project. For example, if some of a resource's projects are 5 day a week projects, another project is a 6 day a week project, and another project is a 7 day a week project – the resource's availability is set to the maximum one – in this case 7 days.
- To reset a Team Member's availability, remove them from the project.
Legend
The legend provides a definition of the color-coding present throughout the Main Window, making it easier for users to understand the data they're viewing.
Date Range & Filters
Use the Date Range and Filter options to further refine the scope of the Resource Utilization content.
Resource Dashboard
The Resource Dashboard page gives you a more detailed view of what scheduled work each resource is assigned and allows you to focus on one or more individuals to understand why they are over or under resourced.
Click on a user's name on the resource bar chart on the right to focus on this user. Use Ctrl-click to focus on two or more users.
Right-click on a user's name in the main visual and click Expand | All to see all the scheduled work that the user is assigned.
Date Range & Filters
Use the Date Range and Filter options to further refine the scope of the Resource Dashboard content.
Project Calendars
The Project Calendars page shows you each project's calendar. This page is particularly useful if you have a project that has a working week that is different than the global setting or has project exception days.
There are two types of Project Exception Days:
- Working Day: Use this to cancel a Non-Working Day.
- Non-Working Day: Use this to make a working day for a particular project into a non-working day.
Date Range & Filters
Use the Date Range and Filter options to further refine the scope of the Project Calendars content.
Resource Utilization Adjustment Process
When adjusting resourcing, the Project Manager can launch the resource report in the Power BI service and download the related PBIX file to open the new resource report in Power BI Desktop. They can then make assignment adjustments in the BrightWork 365 app and view the effects of these changes in realtime using Power BI Desktop, which allows unlimited refreshes of the report data unlike other methods of using Power BI which have limited daily refreshes. This cycle of Adjust in the app > View in Power BI Desktop > Adjust in the app, can be repeated as often as necessary to balance resource workloads. Below are details for using the Resource Utilization Adjustment Process.
Open in Power BI
The Open in Power BI link will open the report in the Power BI Service, displaying the report in a separate webpage.
Download the Report PBIX File
Power BI Desktop is a free download from Microsoft.
- Users require Contributor permission in the relevant Power BI workspace to download the PBIX file.
- When users with Contributor permission access the Power BI My Work Dashboard, instead of only seeing their own work, they will see all users' work.
When using Power BI Desktop for resource utilization purposes be sure not to publish the report as this will affect all users of the report.
One of the added functions provided by the Power BI Service is the ability to download the PBIX file that is associated with the report, which can then be opened in Power BI Desktop. To download the file from the Power BI Service:
- Click File > Download this file.
- Choose to download a copy of your report and data.
Open the PBIX File in Power BI Desktop
- When the file download initiated above is complete, open the PBIX file in Power BI Desktop.
- View the data in Power BI Desktop and choose to refresh the data as necessary using the Refresh option.
If values are missing for columns Hour and Alloc in Power BI Desktop when all rows are collapsed, expand any row and the missing values will be displayed.
