2026-2
Accessing Power Apps Dashboards
There are two options for accessing BrightWork 365 Power Apps dashboards:
(1) On the main navigation, in the Home section, click the Dashboards link.

(2) On the main navigation, in the Projects section, click the Reporting link.

Regardless of how you access dashboards, they contain multiple BrightWork 365 Power Apps charts, each with many views of their own for further drilling down into project details.
The first series of chart category to display will be whichever was set as the default. This default can be changed by clicking on Set as Default.

Using Power Apps Dashboards
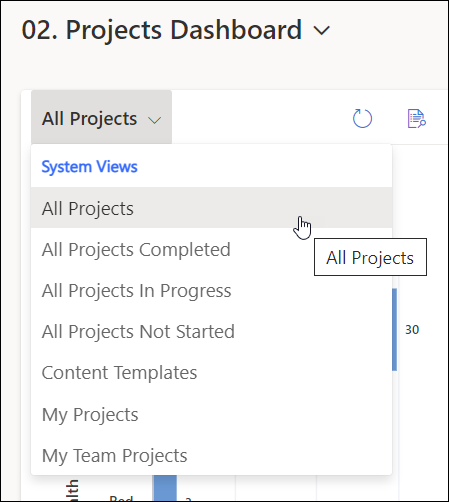
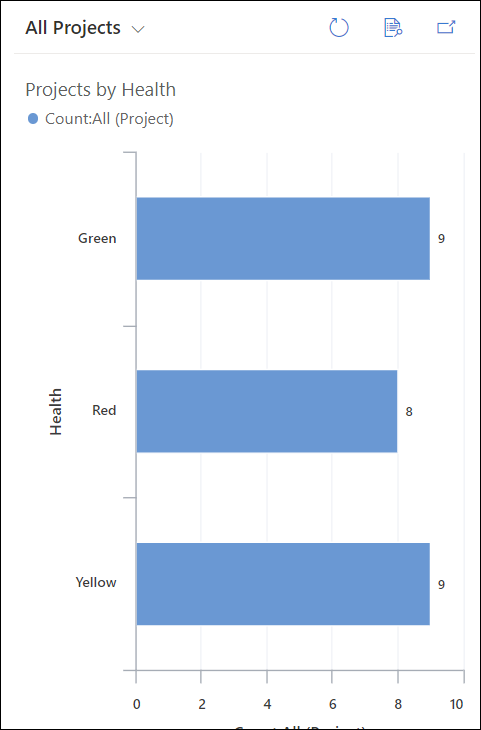
- Choose the desired chart series (e.g., Projects Dashboard), and select the focus within a chart pane by selecting any of the available views (e.g., All Projects).
- (Optional) Click into a chart bar and drill down using any of the relevant attributes.
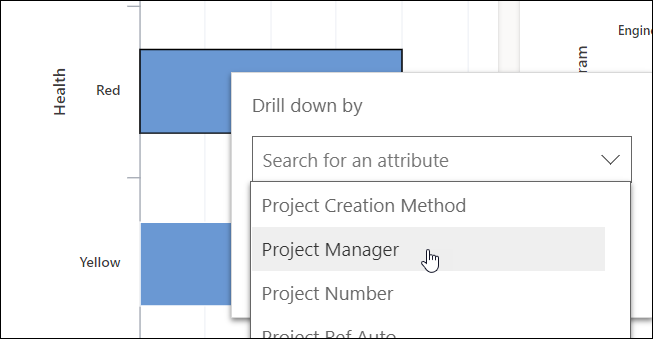


Chart Views
Among the many chart views are the following views:
- My Projects: Lists any project created by the logged in user, or any project in which the logged in user is either the Group Manager, Project Manager or Project Sponsor.
- My Team Projects: Lists any project on which the logged in user is a member of the Project Team.

Troubleshooting
- Percent values do not appear when drilling down within a Power Apps Chart: There is no current workaround for this as it is Microsoft Power Platform behavior.
2026-1 & 2025-2
The Dashboards Section
The Dashboards section contains multiple BrightWork 365 Power Apps charts, each with many views of their own for further drilling down into project details.
The first series of chart category to display will be whichever was set as the default. This default can be changed by clicking on Set as Default.
Using the Power Apps Dashboards
- Choose the desired chart series (e.g., Projects Dashboard), and select the focus within a chart pane by selecting any of the available views (e.g., All Projects).
- (Optional) Click into a chart bar and drill down using any of the relevant attributes.
Chart Views
Among the many chart views are the following views:
- My Projects: Lists any project created by the logged in user, or any project in which the logged in user is either the Group Manager, Project Manager or Project Sponsor.
- My Team Projects: Lists any project on which the logged in user is a member of the Project Team.
Troubleshooting
- Percent values do not appear when drilling down within a Power Apps Chart: There is no current workaround for this as it is MS Power Platform behavior.
