2026-2
Project Management Context
Project teams are generating more data than ever. In order to achieve success, project managers need to compile all of this information into high-level, easy-to-consume Dashboards. Using Power BI dashboards and reports in the Power Platform, BrightWork 365 helps senior executives and PMO leads to easily access, analyze, and action this data.
With BrightWork 365 out-of-the-box dashboards for project management you can:
- Use Power App Dashboards to compile and consume your project data
- Leverage Power BI Dashboards for project portfolio management
- Connect your data to Power BI and Power Apps
Additional Power BI reports can be added as desired through customization - contact your Customer Success Partner for more information.
- In order to view or use BrightWork 365 Power BI Dashboards, users must have a Microsoft Power BI Pro license or E5/G5 plan, and at least Viewer permission for the relevant Power BI Workspace.
- See Security and Power BI Reports for important information related to user access to reports.
Using Power BI Dashboards
- For dashboards that indicate Late and Overdue work: "Late" means the Start Date has been missed, and "Overdue" means the Finish Date has been missed.
- You can improve Power BI readability by collapsing the Filters pane on the right side of the screen and the left nav.
- Mobile-optimized report views display only when you use the Power BI mobile apps for iOS and Android. When viewed through a web browser, reports always display in the standard, non-optimized view. See About mobile-optimized Power BI reports - Power BI | Microsoft Learn.
You have two options for accessing BrightWork 365 Power BI dashboards.
- On the main navigation, in the Home section, click the Dashboards link.
- On the main navigation, in the Portfolios section, click the Reporting link.
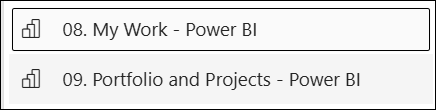
Power BI Dashboards are differentiated from Power Apps dashboards in the dashboards drop-down by having the words Power BI in their titles.
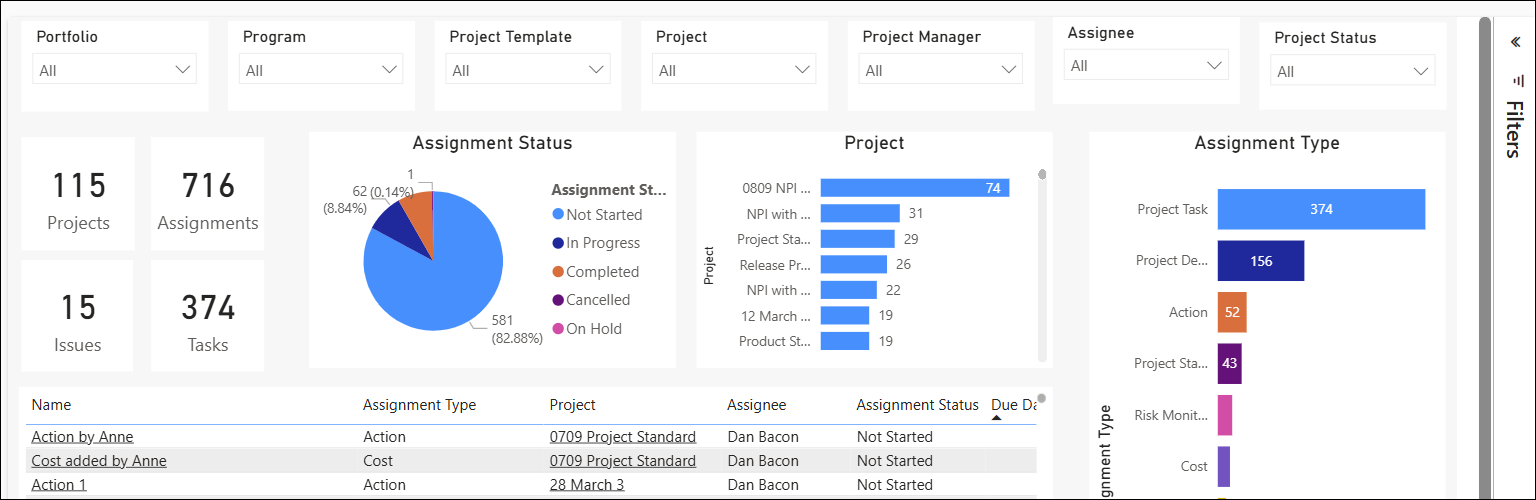
The Power BI dashboards include detailed interactive reports related to various elements of the system including Portfolios, Programs, Templates, Projects, and Project Managers. The report results can be narrowed down further by using Ctrl-Click to choose several chart objects or the checkboxes within an object, or with the Filters configuration options on the side of the screen.

To expand all report list groupings, right-click on the grouped column (e.g., Project) and click Expand to next level.

To collapse all report list groupings, right-click on the grouped column (e.g., Project) and click Drill up.

Top Toolbar Control Buttons

- Drill up: Zooms out to the previous, higher-level category in your data hierarchy. For example, if you are looking at "Months," clicking this moves you back to "Quarters".
- Turn on Drill down: Enables "Drill Mode". When this is activated, clicking on a specific data point (e.g., the "West" region bar or "Q1") will drill down exclusively into the details of that specific data point.
- Go to the next level in the hierarchy: Moves the entire visual to the next level of the hierarchy, bypassing individual data points. For instance, it changes the X-axis from "Years" to show all "Quarters" combined across all years, rather than Q1 of 2025, Q1 of 2026, etc.
- Expand all down one level in the hierarchy: Expands the visual to display both the current level and the next level of the hierarchy simultaneously.
- Copy as image with caption: An export feature that captures the current state of a visual (including its applied filters) as an image for sharing.
- Filters and slicers: In Power BI, Buttons, Filters, and Slicers are interconnected tools used to manage and navigate report data. Slicers are on-canvas visual controls for end-users to explore data. Filters restrict data at the visual, page, or report level. Buttons add interactive, app-like functionality, such as resetting or applying these selections.
- Focus mode: Lets you expand any single visual (like a chart or graph) to fill the entire report canvas. It temporarily hides all other visuals and page navigation elements, giving you a distraction-free, full-screen view for deep data analysis.
- Ellipses menu:
- Export data: Allows users to download the data backing a specific visual or table into a local file (such as an Excel spreadsheet or CSV) for further offline analysis.
- Show as a table: Instantly converts any chart or graph into a detailed grid. It displays the exact underlying data, allowing users to analyze numbers row by row instead of visually.
- Spotlight: Dims all other visuals on a page to make a single visual stand out.
- Get insights: The Insights pane currently shows you three types of insights – Anomalies, Trends, and Key Performance Indicator (KPI) analysis. The Top tab shows you Top insights. All tab shows you both Top insights and other insights.
- Sort descending: Allows you to arrange your visual's data in highest-to-lowest numerical value, Z-to-A alphabetical order, or newest-to-oldest date order.
- Sort ascending: Organizes your chart or table data from lowest to highest, or alphabetically (A to Z).
- Sort by: Tells Power BI to order by a column’s values.
Bottom Section
Along the bottom of Power BI Dashboard screens are tabs for additional report focus options - below is an example from the Portfolio and Projects - Power BI Dashboard:

On the various tabs you can easily view item status such as Complete, Future, Late (start is overdue), Overdue (due date has passed), and Underway.
You can view the Last Refresh time of reports at the bottom of report pages. BrightWork does not force refreshes after data changes, the refreshes will occur on the schedule your administrator configures in your organization's Power BI admin settings.

BrightWork 365 Power BI Dashboard Examples
My Work - Power BI

Portfolio and Projects - Power BI

Power BI dashboard slicer settings apply to all report pages of the Portfolio and Projects - Power BI dashboard. This synchronization allows viewers to move between report pages without having to reapply slicer logic.

You have the option to drill down into further detail on the associated projects, so that the reports are more useful and efficient for teams to help them exercise visibility and control.
In a Project column cell, right-click to expose a context menu to drill through and open report pages for the selected project.

Clicking the Back to button on all report pages brings the user back to the Portfolio Dashboard.

Clicking the Reset button on all report pages removes the project context for that page.

Resource Utilization

See Resource Utilization - Power BI for details.
Open in Power BI Service
Microsoft Open in Power BI Service offers additional options to interact with BrightWork 365 reports. Users can conveniently access the service by clicking Open in Power BI on a BrightWork 365 Power BI dashboard page.

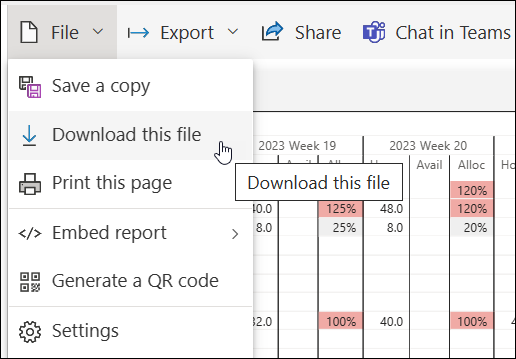
After navigating to the Power BI page, users are presented with menu options along the top of the web page including File (Print, Embed), Export (PDF, PowerPoint), Share (Copy link, Mail, Teams), and Chat in Teams.

For more information see Customize Power BI Dashboards and these Microsoft resources:
- https://docs.microsoft.com/en-us/power-bi/
- https://docs.microsoft.com/en-us/learn/powerplatform/power-bi?WT.mc_id=powerbi_landingpage-docs-link
Forcing Dashboard Data Refreshes
Project Managers can make data adjustments in the BrightWork 365 app and view the effects of these changes immediately using Power BI Desktop, which allows unlimited refreshes of the report data unlike other methods of using Power BI which have limited daily refreshes. This cycle of Adjust in the app > View in Power BI Desktop > Adjust in the app, can be repeated as often as necessary. Below are details for using this data refresh process.
Open in Power BI

The Open in Power BI link will open the report in the Power BI Service, displaying the report in a separate webpage.
Download the Report PBIX File
Power BI Desktop is a free download from Microsoft.
- Users require Contributor permission in the relevant Power BI workspace to download the PBIX file.
- When users with Contributor permission access the Power BI My Work Dashboard, instead of only seeing their own work, they will see all users' work.
When using Power BI Desktop for dashboard data refresh purposes be sure not to publish the report as this will affect all users of the report.
One of the added functions provided by the Power BI Service is the ability to download the PBIX file that is associated with the report, which can then be opened in Power BI Desktop. To download the file from the Power BI Service:
- Click File > Download this file.
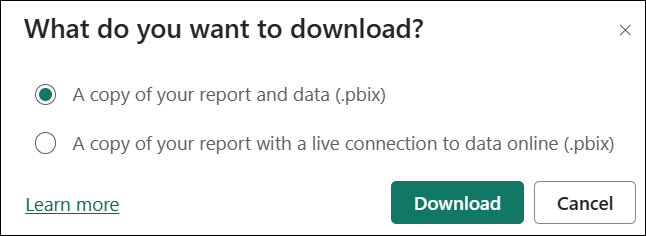
- Choose to download a copy of your report and data.


Open the PBIX File in Power BI Desktop
- When the file download initiated above is complete, open the PBIX file in Power BI Desktop.
- View the data in Power BI Desktop and choose to refresh the data as necessary using the Refresh option.
2026-1 & 2025-2
Project Management Context
Project teams are generating more data than ever. In order to achieve success, project managers need to compile all of this information into high-level, easy-to-consume Dashboards. Using Power BI dashboards and reports in the Power Platform, BrightWork 365 helps senior executives and PMO leads to easily access, analyze, and action this data.
With BrightWork 365 out-of-the-box dashboards for project management you can:
- Use Power App Dashboards to compile and consume your project data
- Leverage Power BI Dashboards for project portfolio management
- Connect your data to Power BI and Power Apps
To view Power BI dashboards, click into the Home section of Main Nav > Dashboards, and use the Dashboard drop-down to choose the desired Power BI Dashboard. Power BI Dashboards are differentiated from Power Apps Charts in the drop-down by having the words Power BI in their titles.
Additional Power BI reports can be added as desired through customization - contact your Customer Success Partner for more information.
In order to view or use BrightWork 365 Power BI Dashboards, users must have a Microsoft Power BI Pro license or E5/G5 plan, and at least Viewer permission for the relevant Power BI Workspace.
Viewing Power BI Dashboards
- For dashboards that indicate Late and Overdue work: "Late" means the Start Date has been missed, and "Overdue" means the Finish Date has been missed.
- You can improve Power BI readability by collapsing the Filters pane on the right side of the screen and the left nav.
- Mobile-optimized report views display only when you use the Power BI mobile apps for iOS and Android. When viewed through a web browser, reports always display in the standard, non-optimized view. See About mobile-optimized Power BI reports - Power BI | Microsoft Learn.
The Power BI dashboards include detailed interactive reports related to various elements of the system including Portfolios, Programs, Templates, Projects, and Project Managers. The report results can be narrowed down further by using Ctrl-Click to choose several chart objects or the checkboxes within an object, or with the Filters configuration options on the side of the screen.
To expand all report list groupings, right-click on the grouped column (e.g., Project) and click Expand to next level.
To collapse all report list groupings, right-click on the grouped column (e.g., Project) and click Drill up.
Along the bottom of Power BI Dashboard screens are tabs for additional report focus options - below is an example from the Portfolio and Projects - Power BI Dashboard:
On the various tabs you can easily view item status such as Complete, Future, Late (start is overdue), Overdue (due date has passed), and Underway.
You can view the Last Refresh time of reports at the bottom of report pages. BrightWork does not force refreshes after data changes, the refreshes will occur on the schedule your administrator configures in your organization's Power BI admin settings.
BrightWork 365 Power BI Dashboards
My Work
Portfolio and Projects

Resource Utilization

Open in Power BI Service
Microsoft Open in Power BI Service offers additional options to interact with BrightWork 365 reports. Users can conveniently access the service by clicking Open in Power BI on a BrightWork 365 Power BI dashboard page.

After navigating to the Power BI page, users are presented with menu options along the top of the web page including File (Print, Embed), Export (PDF, PowerPoint), Share (Copy link, Mail, Teams), and Chat in Teams.
For more information see Customize Power BI Dashboards and these Microsoft resources:
- https://docs.microsoft.com/en-us/power-bi/
- https://docs.microsoft.com/en-us/learn/powerplatform/power-bi?WT.mc_id=powerbi_landingpage-docs-link
Forcing Dashboard Data Refreshes
Project Managers can make data adjustments in the BrightWork 365 app and view the effects of these changes immediately using Power BI Desktop, which allows unlimited refreshes of the report data unlike other methods of using Power BI which have limited daily refreshes. This cycle of Adjust in the app > View in Power BI Desktop > Adjust in the app, can be repeated as often as necessary. Below are details for using this data refresh process.
Open in Power BI

The Open in Power BI link will open the report in the Power BI Service, displaying the report in a separate webpage.
Download the Report PBIX File
Power BI Desktop is a free download from Microsoft.
- Users require Contributor permission in the relevant Power BI workspace to download the PBIX file.
- When users with Contributor permission access the Power BI My Work Dashboard, instead of only seeing their own work, they will see all users' work.
When using Power BI Desktop for dashboard data refresh purposes be sure not to publish the report as this will affect all users of the report.
One of the added functions provided by the Power BI Service is the ability to download the PBIX file that is associated with the report, which can then be opened in Power BI Desktop. To download the file from the Power BI Service:
- Click File > Download this file.
- Choose to download a copy of your report and data.
Open the PBIX File in Power BI Desktop
- When the file download initiated above is complete, open the PBIX file in Power BI Desktop.
- View the data in Power BI Desktop and choose to refresh the data as necessary using the Refresh option.
