2026-2
Project Management Context
Status reporting is an extremely efficient method for keeping multiple stakeholders informed about how projects are progressing. Crucial information such as a project's overall status and health, attributes your stakeholders are likely very interested in seeing, can easily be updated and distributed by the project manager. BrightWork 365 provides project managers with an intuitive interface for keeping metrics and qualitative information updated at their leisure, as well as creating status snapshots to keep a trail of how the project has performed over time.
Quickly identify projects that have not been updated recently with the Latest Status Report Date field. Customers can optionally add this column and the Latest Status Report link column, by configuring the Projects > All Projects views.

Status Tab
The Status tab displays current metrics and KPIs about the project.

The Schedule date values will automatically populate based on work item dates, and the values for Project Status, % Complete (Percent Complete), and other KPIs are manually set by the project manager.
Health Key Performance Indicator (KPI)
The Health KPI can either be set manually by a user with appropriate privileges, or automatically by the system. If set automatically, the KPI color will match whatever is the "worst" color value among the other KPIs (Yellow is worse than Green and Red is worse than Yellow); any manual changes made to the KPI will not be saved permanently.
To toggle the automatic Health KPI setting on and off:
- In the project's Charter tab, click the Settings and Actions link.
- In the Settings tab, toggle the Set Health Automatically switch.

Set Health Automatically will not go into effect unless a value is selected in one of the other indicator columns; this is to prevent locking Health as a blank value.
Status Reports Tab
In the Status Reports tab a snapshot record of the current status information can be saved, and the history of previously created status reports can be viewed.
Saved status reports will be added to the list of any previously created status reports. The status report data is stored within your Microsoft 365 Dataverse.
To create a new status report:
- In the Status Reports tab click the ellipses and +New Status Report.
- Fill in all relevant columns.
- To save the status report:
- To save a draft of the status report, click Save or Save and Close in the ribbon.
- To save a final version of the status report, set Complete Status Report to Yes.
- After saving a draft status report, values that were initially automatically copied in from the Status tab (i.e., the project's "Status" value) will not be updated with any new values from the Status tab upon subsequent edits of the draft status report.
Email Report to Sponsor & Complete Status Report
If you would like an email to be sent to the Sponsor, you must check the box for Email Report to Sponsor.
When you first set Email Report to Sponsor to Yes and then set Complete Status Report to Yes (in that order), an HTML report will be emailed to the Sponsor, the Project Manager and the person that set the report to the completed status. The email will be sent from the account that was used to install BrightWork 365, unless Send On Behalf of mailbox permission has been configured, as noted later in this article.
Status related icons may fail to load in older versions of the Outlook desktop client.
Email Report to Project Team
If you would like an email to be sent to the Project Team, you must check the box for Email Report to Project Team. Project team members with Access Level = Edit will be included as recipients.
Include Additional Recipients
A project's actual Project Manager can add a list of additional internal and external recipients during the Status Report creation stage.

- The email addresses of External Email Recipients need to be separated by a semicolon.
- Do not use carriage returns.
The actual Project Manager can also add a default list of additional internal and external project status report email recipients for easy repeatable use. The list is saved so that they do not have to recreate it with every status report. In addition, they can add names or delete names as needed prior to sending the status reports. Out of scope for these default lists:
- Bulk Updates in Project Settings views
- Copy Project
- Content Templates
If you would like an email to be sent to additional recipients, you must check the box for Include Additional Recipients.
Status reports can be shared with any user that has the BrightWork Team Member security role, regardless of their Project Access Level.
- You can only include additional users that are part of the BrightWork 365 environment.
- If you choose not to email the Sponsor, and also leave the Additional Email Recipients column empty, it will use the Modified by person's email for the To address.
- There is no imposed limit on the number of additional users that can be entered.
To create a default list of recipients to include with status report emails, see Settings and Actions.
Custom Status Report Name
Users have the ability to add a custom name for a status report so that they can specify greater context to what the purpose of the specific report is. They can use this field to add any additional information that would be useful for the stakeholders or team members who are receiving it. The user can edit the Status name when they first open the form to add details to the report. The name of the report can be edited up until the point that the 'Complete Status Report' toggle option is clicked and the form is saved.

Send On Behalf Of Mailbox Permission Setting
Out of the box, when a status report is emailed to Project Sponsors or other stakeholders, it will be sent from the account that was used to install BrightWork 365. This email sending account can be changed to the account of the user submitting the status report if that account has been given Send On Behalf of mailbox permission, which can be configured by your organization's Microsoft 365 System Admin; for instructions see Microsoft article Give mailbox permissions to another user.
Printing Status Reports
- Create your status report.
- Collapse the left navigation.
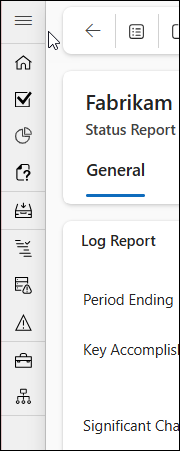
- Click Ctrl-P on your keyboard, select Microsoft Print to PDF as the printer, and set up as below:
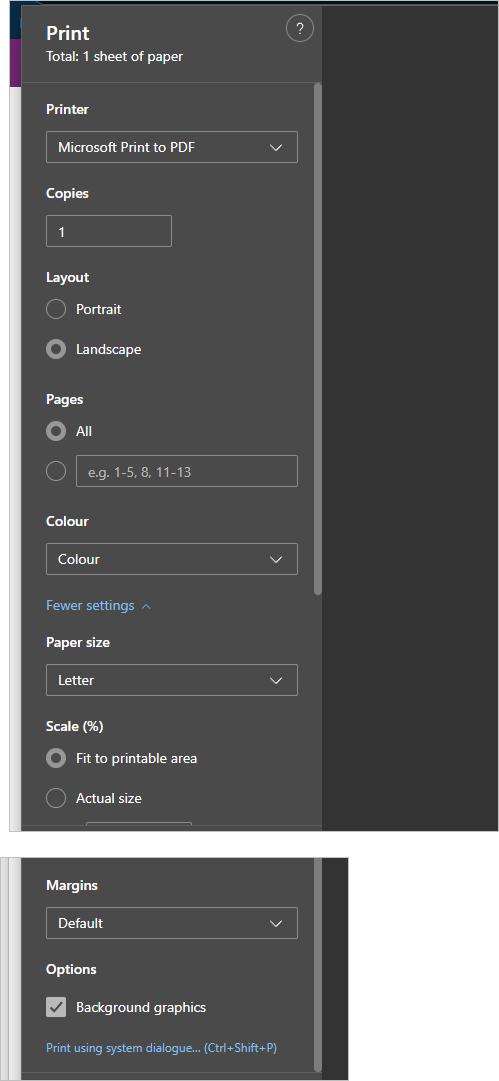
- Print to paper or share as an attachment.


Project Status Dashboard - Power BI
The Project Status Dashboard helps keep users better informed about how projects throughout the system are progressing in a convenient single location, with the ability to quickly switch between projects. Status data is pulled from the Status tab in projects.
Users access the Power BI Project Status report by clicking the Project Status Dashboard tab in the report view Portfolio and Projects - Power BI. You can easily switch between projects with a convenient project selector.
Report components include:
- Project selector drop-down menu (Lists all projects)
- Project Dates (Current Start/Current Finish/Target Start/Target Finish)
- % Complete Chart (0% - 100%)
- List of Assignments (Title, Assignee, Type, Status, Date Due (Sorted by due soonest) (Day/Month/Year)
- Selected Project Link (Click to open)
- Health Indicators (Health/Cost/Time/Scope)
- Task Status Pie Chart (Not Started/In Progress/Completed)
- Tasks (Amount within selected project)
- Open Tasks (Amount within selected project)
- Closed Tasks (Amount within selected project)
- Late Tasks (Amount within selected project)
- Issues (Amount within selected project)
- Risks (Amount within selected project)
- Assignments by Assignee (Bar Chart) (Assignment Type) (within selected project)
- Assignment Type (by Type) (Bar Chart) (within selected project)
- Last Refresh Date
2026-1 & 2025-2
Project Management Context
Status reporting is an extremely efficient method for keeping multiple stakeholders informed about how projects are progressing. Crucial information such as a project's overall status and health, attributes your stakeholders are likely very interested in seeing, can easily be updated and distributed by the project manager. BrightWork 365 provides project managers with an intuitive interface for keeping metrics and qualitative information updated at their leisure, as well as creating status snapshots to keep a trail of how the project has performed over time.
Quickly identify projects that have not been updated recently with the Latest Status Report Date field. Customers can optionally add this column and the Latest Status Report link column, by configuring the Projects > All Projects views.
Status Tab
The Status tab displays current metrics and KPIs about the project.
The Schedule date values will automatically populate based on work item dates, and the values for Project Status, % Complete (Percent Complete), and other KPIs are manually set by the project manager.
In addition to using the % Complete slider, you can also manually enter a percent value by double-clicking on the number below the slider.

The Health KPI can either be set manually by a user with appropriate privileges, or automatically by the system. If set automatically, the KPI color will match whatever is the "worst" color value among the other KPIs (Yellow is worse than Green and Red is worse than Yellow); any manual changes made to the KPI will not be saved permanently.
To toggle the automatic Health KPI setting on and off, in Project Settings use the Set Health Automatically switch.

Set Health Automatically will not go into effect unless a value is selected in one of the other indicator columns; this is to prevent locking Health as a blank value.
Status Reports Tab
In the Status Reports tab a snapshot record of the current status information can be saved, and the history of previously created status reports can be viewed.
Saved status reports will be added to the list of any previously created status reports. The status report data is stored within your Microsoft 365 Dataverse.
To create a new status report:
- In the Status Reports tab click the ellipses and +New Status Report.
- Fill in all relevant columns.
- To save the status report:
- To save a draft of the status report, click Save or Save and Close in the ribbon.
- To save a final version of the status report, set Complete Status Report to Yes.
- After saving a draft status report, values that were initially automatically copied in from the Status tab (i.e., the project's "Status" value) will not be updated with any new values from the Status tab upon subsequent edits of the draft status report.
Email Report to Sponsor & Complete Status Report
If you would like an email to be sent to the Sponsor, you must check the box for Email Report to Sponsor.
When you first set Email Report to Sponsor to Yes and then set Complete Status Report to Yes (in that order), an HTML report will be emailed to the Sponsor, the Project Manager and the person that set the report to the completed status. The email will be sent from the account that was used to install BrightWork 365, unless Send On Behalf of mailbox permission has been configured, as noted later in this article.
Status related icons may fail to load in older versions of the Outlook desktop client.
Email Report to Project Team
If you would like an email to be sent to the Project Team, you must check the box for Email Report to Project Team. Project team members with Access Level = Edit will be included as recipients.
Include Additional Recipients
A project's actual Project Manager can add a list of additional internal and external recipients during the Status Report creation stage.
- The email addresses of External Email Recipients need to be separated by a semicolon.
- Do not use carriage returns.
The actual Project Manager can also add a default list of additional internal and external project status report email recipients for easy repeatable use. The list is saved so that they do not have to recreate it with every status report. In addition, they can add names or delete names as needed prior to sending the status reports. Out of scope for these default lists:
- Bulk Updates in Project Settings views
- Copy Project
- Content Templates
To create the default list of recipients to include with status report emails:
- Navigate to Charter tab > Schedule Settings > Project Settings.
- Enter the default list of users in the field Default Internal Email Recipients and/or Default External Email Recipients.
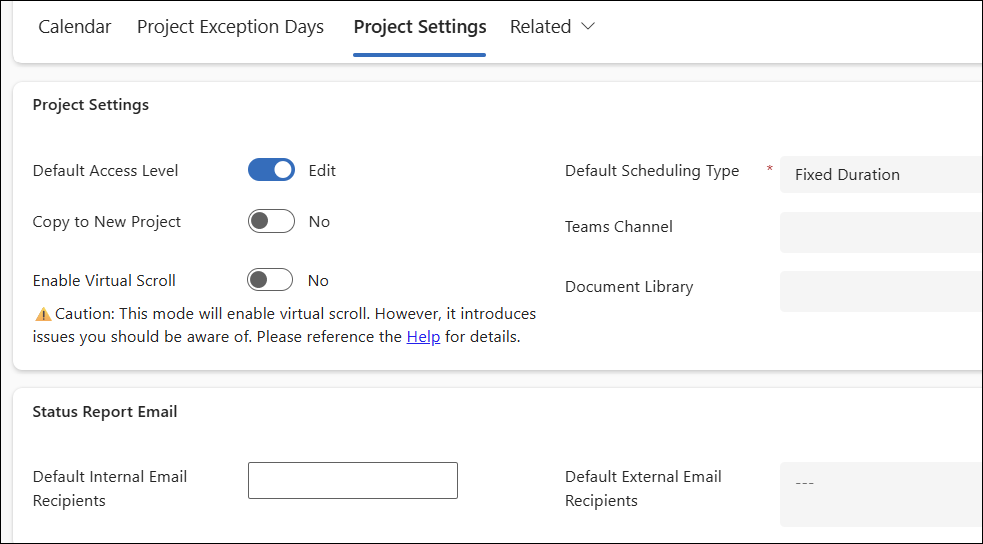
- Click Save.

If you would like an email to be sent to additional recipients, you must check the box for Include Additional Recipients.
Status reports can be shared with any user that has the BrightWork Team Member security role, regardless of their Project Access Level.
- You can only include additional users that are part of the BrightWork 365 environment.
- If you choose not to email the Sponsor, and also leave the Additional Email Recipients column empty, it will use the Modified by person's email for the To address.
- There is no imposed limit on the number of additional users that can be entered.
Custom Status Report Name
Users have the ability to add a custom name for a status report so that they can specify greater context to what the purpose of the specific report is. They can use this field to add any additional information that would be useful for the stakeholders or team members who are receiving it. The user can edit the Status name when they first open the form to add details to the report. The name of the report can be edited up until the point that the 'Complete Status Report' toggle option is clicked and the form is saved.
Send On Behalf Of Mailbox Permission Setting
Out of the box, when a status report is emailed to Project Sponsors or other stakeholders, it will be sent from the account that was used to install BrightWork 365. This email sending account can be changed to the account of the user submitting the status report if that account has been given Send On Behalf of mailbox permission, which can be configured by your organization's Microsoft 365 System Admin; for instructions see Microsoft article Give mailbox permissions to another user.
Printing Status Reports
- Create your status report.
- Collapse the left navigation.
- Click Ctrl-P on your keyboard, select Microsoft Print to PDF as the printer, and set up as below:
- Print to paper or share as an attachment.
Project Status Dashboard - Power BI
The Project Status Dashboard helps keep users better informed about how projects throughout the system are progressing in a convenient single location, with the ability to quickly switch between projects. Status data is pulled from the Status tab in projects.
Users access the Power BI Project Status report by clicking the Project Status Dashboard tab in the report view Portfolio and Projects - Power BI. You can easily switch between projects with a convenient project selector.
Report components include:
- Project selector drop-down menu (Lists all projects)
- Project Dates (Current Start/Current Finish/Target Start/Target Finish)
- % Complete Chart (0% - 100%)
- List of Assignments (Title, Assignee, Type, Status, Date Due (Sorted by due soonest) (Day/Month/Year)
- Selected Project Link (Click to open)
- Health Indicators (Health/Cost/Time/Scope)
- Task Status Pie Chart (Not Started/In Progress/Completed)
- Tasks (Amount within selected project)
- Open Tasks (Amount within selected project)
- Closed Tasks (Amount within selected project)
- Late Tasks (Amount within selected project)
- Issues (Amount within selected project)
- Risks (Amount within selected project)
- Assignments by Assignee (Bar Chart) (Assignment Type) (within selected project)
- Assignment Type (by Type) (Bar Chart) (within selected project)
- Last Refresh Date
